The Environmental and Sustainability Value of FastOx
FastOx® Gasification Technology
Environmental & Sustainability Value
Sierra Energy’s analyses indicate that FastOx gasification technology can transform waste into valuable products and provide meaningful environmental benefits, including:
Reducing greenhouse gas (GHG) emissions to help slow global warming:
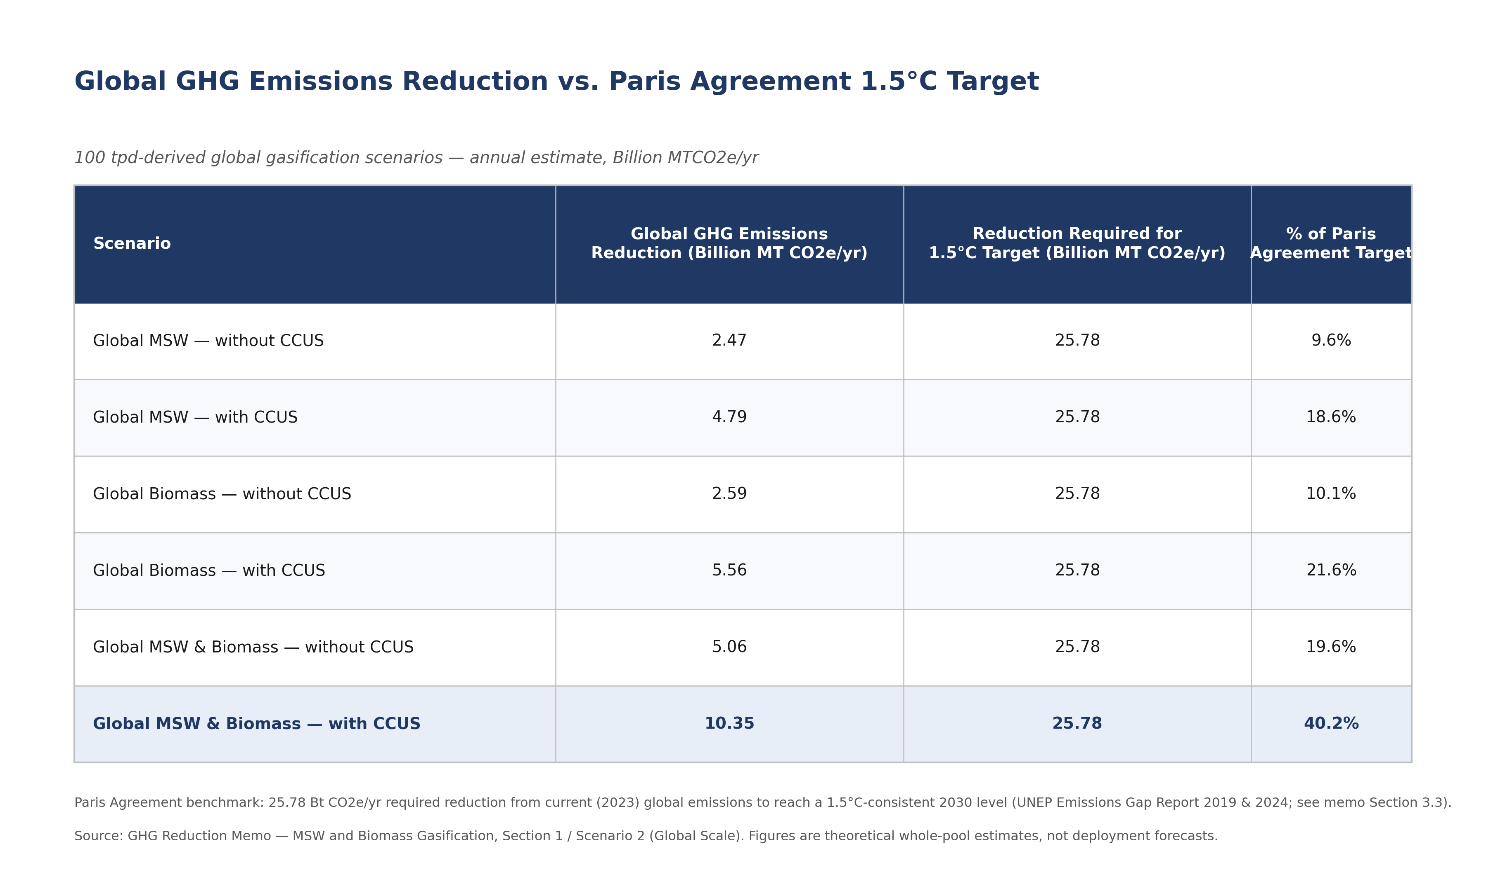
If FastOx gasification technology were applied to the entire addressable global pool of MSW and biomass waste, it could achieve up to 40% of the Paris Agreement GHG emissions reduction target.
Reducing the amount of waste sent to landfills by converting waste into valuable products while avoiding generation of hazardous bottom ash and limiting dioxins and furans:
FastOx gasification projects could reduce nearly 100% of the 0.8 billion MT of MSW going to landfills today and could reduce future landfill demand associated with the 1.1 billion MT of MSW that is openly dumped or left uncollected.
Reducing uncollected waste and open dumping of waste, and reducing associated environmental pollution, disease, risk, and oceanic accumulation of plastic waste.
By providing a strong financial incentive for collection, FastOx gasification plants could reduce the open dumping of 0.4 billion MT of MSW and support collection of 0.7 billion MT of uncollected waste.
Reducing GHG emissions
Per the United Nations University’s Institute for Environment and Human Security, warming presents sharply escalating risks for societies and economies: “It projects that each year in this period will be about 1.2°C to 1.9°C warmer than the 1850–1900 average, with a 70 per cent chance that the five-year average for 2025–2029 will be above this threshold. Every fraction of a degree of additional warming intensifies heatwaves, extreme rainfall, droughts, ice loss, ocean heating and sea level rise, compounding harm for people and ecosystems worldwide.”
FastOx gasification technology can help slow global warming by reducing GHG emissions. Each FastOx gasification project can affect GHG emissions in multiple areas:
Landfill methane emissions avoidance: After Municipal Solid Waste (MSW) arrives in a landfill or a dump, it is buried as new MSW comes in and is dumped on top of it. This results in anaerobic decomposition of organic material, including food, paper, wood, and yard waste, producing methane gas, which can have a higher global warming impact than CO2 over a 20-year time frame. Methane emissions from food waste in landfills contribute to global GHG emissions. When MSW is sent to a FastOx gasification project instead of a landfill, landfill methane emissions may be reduced or avoided, depending on waste composition, project configuration, and local conditions.
Open burning emissions avoidance: Agricultural residue and forest waste are commonly disposed of by open burning in fields or slash piles, with material added and burned as it accumulates. This results in uncontrolled combustion of organic material, producing fine particulate matter, black carbon, carbon monoxide, and volatile organic compounds, which have significant regional air quality and public health impacts. When this waste is sent to a FastOx gasification project instead of being burned, these emissions can be reduced or avoided.
Field decomposition methane emissions avoidance: Agricultural residue and forest waste left unprocessed in the field or forest decompose over months or years, often under moist or compacted conditions that drive anaerobic decomposition of organic material. This produces methane gas, which has a higher global warming impact than CO2 over a 20-year time frame. When this waste is sent to a FastOx gasification project instead of being left to decompose, methane emissions can be reduced or avoided.
Gasification emissions: FastOx gasification projects may produce GHG emissions from fossil-based waste, such as plastics and rubber, and from waste transport.
Energy offset: FastOx gasification projects can offset other energy production, depending on the project’s product slate and local energy mix. Energy offset is the GHG emissions from the replaced energy production.
Carbon Capture and Sequestration (CCUS): FastOx gasification projects that capture CO2 and permanently store it underground provide additional GHG emissions reduction.
Clinker Replacement Benefit: FastOx gasification slag can replace a portion of clinker and its associated GHG emissions in cement, where the slag meets applicable specifications.
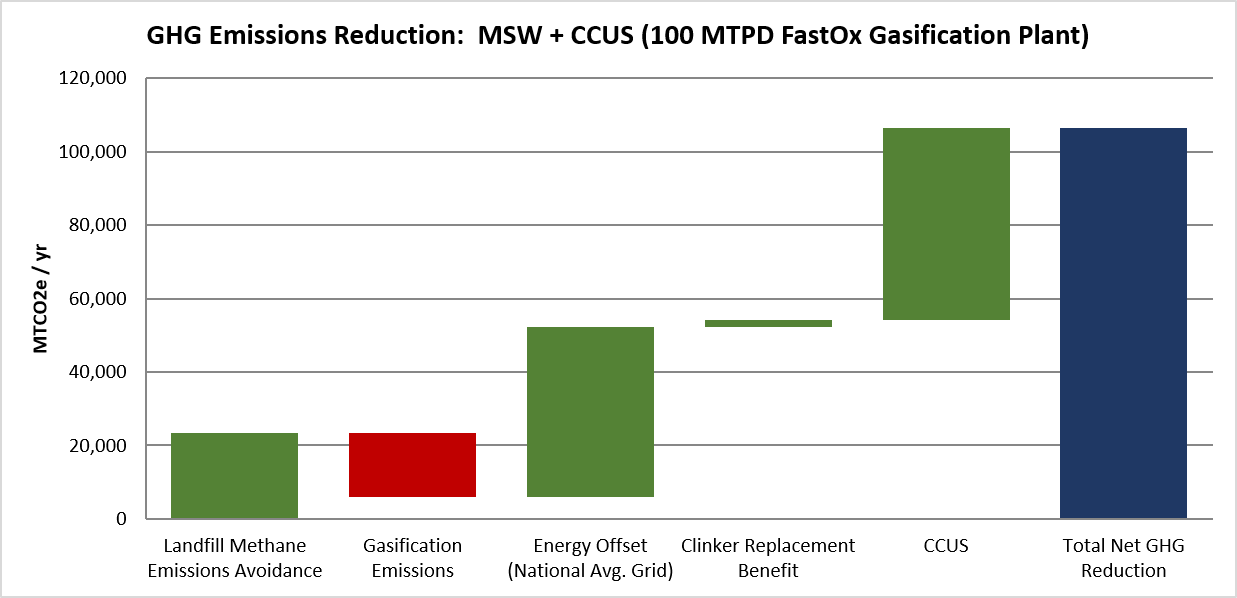
A single 100 MTPD FastOx gasification plant converting MSW into electricity is estimated to reduce GHG emissions by 54,000 MT CO2e/year without CCUS and 106,000 MT CO2e/year with CCUS.
FastOx gasification technology has the potential to make a significant impact on global warming if applied to all MSW that is not incinerated, recycled, composted, or sent to anaerobic digestion, as well as to all forest and agricultural biomass. If FastOx gasification technology were applied to the entire addressable global pool of MSW and biomass waste, it could achieve the following GHG emissions reductions:
20% of the Paris Agreement target without CCUS
40% of the Paris Agreement target with CCUS
Reducing the amount of waste in landfills
Global available landfill capacity is shrinking due to the following factors:
Restrictions on landfill disposal: In the EU, the Landfill Directive is pushing municipal waste sent to landfill down to a target of 10% by 2035, and the share of EU waste sent to landfill has already fallen from 61% to 23% between 1995 and 2022 as recycling ramped up. In North America, older unlined or non-compliant sites are being phased out and consolidated into fewer, more regulated facilities, a trend reshaping supply through rising land costs, community opposition to new sites, and the ongoing phase-out of unlined landfills.
Rising waste volumes outpacing capacity, especially in developing regions: “Around the world, waste generation rates are rising. In 2020, the world was estimated to generate 2.24 billion tonnes of solid waste, amounting to a footprint of 0.79 kilograms per person per day. With rapid population growth and urbanization, annual waste generation is expected to increase by 73% from 2020 levels to 3.88 billion tonnes in 2050,” according to the World Bank report, What a Waste 2.0: A Global Snapshot of Solid Waste Management to 2050. The fastest growth is in Sub-Saharan Africa and South Asia, regions that currently dispose of more than half their waste in open, uncontrolled landfills rather than engineered ones.
Land and siting constraints: New landfill development faces increasing cost and community pushback in developed markets, which is squeezing available capacity even where demand for disposal keeps growing.
FastOx gasification technology can reduce the volume of waste going to landfills by up to 100%, depending on feedstock, project configuration, and local requirements. Sierra Energy’s FastOx slagging gasification process converts waste into clean, low-tar syngas and is designed to melt the inorganic fraction of most MSW feedstocks into a vitrified inert stone rather than hazardous bottom ash. MSW can contain hazardous contaminants, including lead, mercury, cadmium, arsenic, chromium, other hazardous metals, and alkali salts. The FastOx slagging gasifier operates at a very high temperature (~2,200 °C), melting hazardous contaminants into a molten slag. The molten slag is removed from the gasifier and cooled, becoming a vitrified inert stone product. TCLP testing shows hazardous metals are immobilized in the vitrified stone matrix. Vitrified stone may be usable as a cement additive, road base, or fill material, subject to applicable specifications, market acceptance, and regulatory approvals.
Incineration and low-temperature pyrolysis/gasification can produce large quantities of hazardous ash. In incineration and low-temperature gasification, hazardous contaminants can be concentrated in the bottom/fly ash waste. The hazardous contaminants can leach out of the bottom/fly ash waste, potentially polluting rainwater, landfill leachate, groundwater, or surface runoff. The resulting leachate can transport toxic metals and organic pollutants into the surrounding environment, where they can affect soil, groundwater, ecosystems, and human health. Incineration produces dioxins and furans in the fly ash, sometimes at hazardous levels.
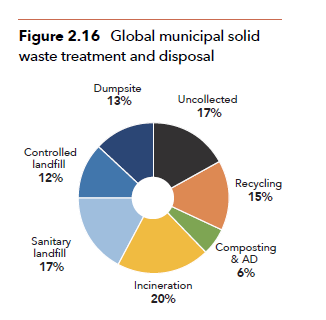
Globally, MSW is sent to landfills or dumpsites, or is left uncollected. FastOx gasification projects could reduce nearly 100% of the 0.8 billion MT of MSW going to landfills today and could reduce future landfill demand associated with the 1.1 billion MT of MSW that is openly dumped or left uncollected.
Reducing uncollected waste and open dumping of waste
Globally, 1.1 billion MT of MSW (~30% of the total estimated 2.8 billion MT of MSW) is openly dumped or left uncollected. Openly dumped and uncollected waste contributes to two major global environmental issues:
Environmental pollution and disease risk. Airborne pollutants can include rotten odors and smoke from burning trash. According to the UN Environment Programme, there are “significant adverse effects on the environment and public health. Emissions from open dumping, including dioxins, furans, mercury, and other hazardous substances, contribute to air, water and soil pollution. Individuals working at these sites and surrounding communities face a high risk of inhaling and ingesting toxic substances, and there is a threat of diseases spreading due to poor sanitation and the presence of insects and vectors.”
Oceanic accumulation of plastic waste and microplastic particle contamination of the food and water supply. A significant amount of improperly disposed plastic waste can make its way into oceans via rivers and other waterways. In 2021, the UN Environment Programme estimated that there were 75–199 million tons of plastics in the ocean. Between 9 and 14 million tons entered aquatic ecosystems in 2016, and this amount is expected to increase to 23–37 million tons per year by 2040 if action is not taken. Small microplastic particles from the breakdown of plastic waste in the ocean and microbeads in health and beauty products pose a potential threat to human health.
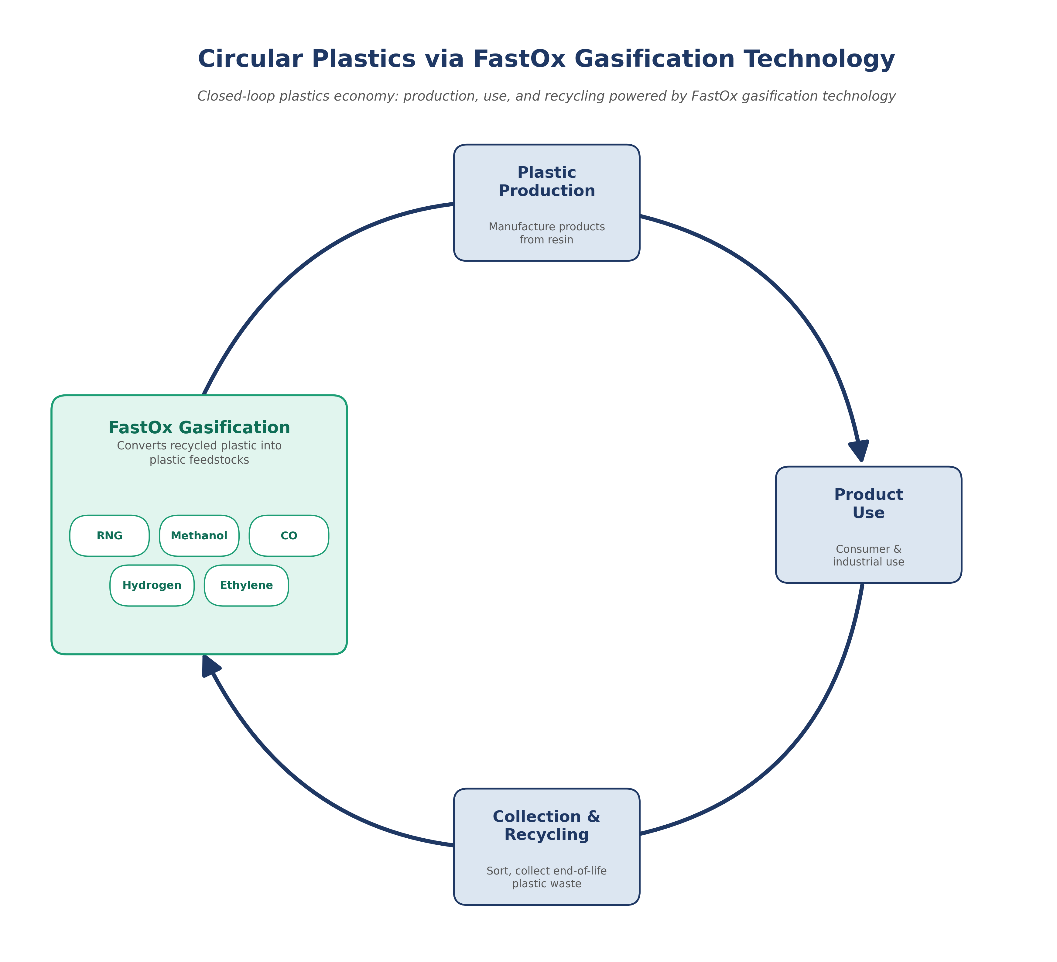
By providing a strong financial incentive for waste collection, FastOx gasification plants could reduce the open dumping of 0.4 billion MT of MSW and support collection of 0.7 billion MT of uncollected waste. FastOx gasification technology can encourage project development in regions where waste is openly dumped or left uncollected by providing a transformation path to high-value products. One of these transformation paths is a more circular plastic economy, enhancing the financial incentive for plastic waste collection. Plastic waste has historically followed a linear path of production, use, and disposal. FastOx gasification technology offers a way to help close that loop by turning end-of-life plastic into building blocks for new plastic production.